Solar panels can reduce your electric bill by 50% to 90% in many homes, but the exact number depends on your electricity usage, local utility rates, roof sunlight, system size, battery storage, and whether your utility credits exported solar power at full retail value or a lower net billing rate.
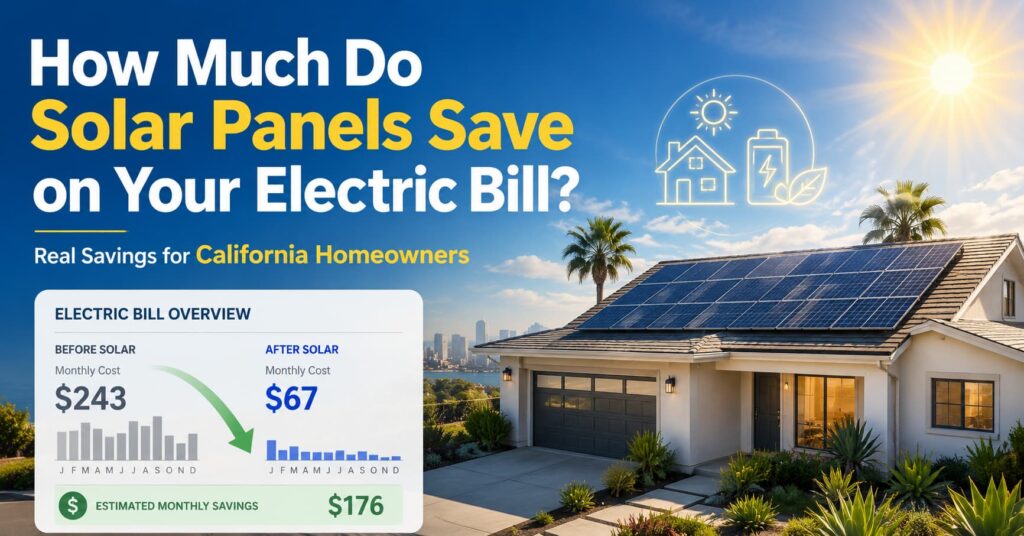
In California, where electric rates are among the highest in the country, the savings can be especially meaningful. A homeowner paying $200 to $350 per month for electricity may save $100 to $300+ per month with a properly sized solar system, and even more if they pair solar with a battery and shift energy use away from expensive evening peak hours.
That said, solar does not always erase the entire bill. In 2026, California homeowners still need to account for fixed charges, monthly minimum charges, time-of-use rates, and the major impact of the Net Billing Tariff, also known as NEM 3.0. Under California’s current Solar Billing Plan, solar energy used directly in the home is usually much more valuable than solar energy exported to the grid. The CPUC says export compensation is generally lower than retail import rates, while batteries can help customers use or export energy during higher-value hours.
Quick Answer: How Much Do Solar Panels Save?
Most homeowners can expect solar panels to reduce their electric bill by:
| Home Type | Typical Monthly Electric Bill Before Solar | Estimated Bill Reduction With Solar | Estimated Monthly Savings |
|---|---|---|---|
| Small home or condo | $100 to $175 | 40% to 70% | $40 to $120 |
| Average home | $175 to $275 | 50% to 80% | $90 to $220 |
| Larger home | $275 to $450 | 60% to 85% | $165 to $380 |
| High-usage home with EV or pool | $350 to $700+ | 60% to 90% | $225 to $600+ |
| Solar plus battery home | Varies | Often 60% to 90% | Strongest savings under TOU and NEM 3.0 |
For California homeowners, the savings are often higher than the national average because electricity is expensive. EnergySage reports California electricity at about 34 cents per kWh as of May 2026, based on real-world customer bills, with California residents shopping for solar using an average of about 910 kWh per month.
For a deeper look at what Californians pay before solar, see our guide to the average electric bill in California.
Why Solar Savings Are So High in California
Solar savings are driven by a simple idea:
The more expensive your utility power is, the more valuable each solar kWh becomes.
If your utility charges 15 cents per kWh, a solar kWh used at home saves about 15 cents. If your utility charges 40 cents per kWh, that same solar kWh can save about 40 cents when used directly in the home.
That is why California is one of the strongest solar markets in the country. Even after NEM 3.0 changed the value of exported solar power, homeowners can still save significantly because the cost of buying electricity from the grid remains high.
Here are real 2026 California utility benchmarks:
| Utility | 2026 Rate / Bill Reference | Why It Matters for Solar |
|---|---|---|
| PG&E | 41.46 cents/kWh average residential bundled Non-CARE rate as of Jan. 1, 2026 | Every solar kWh used at home can offset very expensive grid power. |
| SCE | New average residential rate of 34.5 cents/kWh as of Jan. 1, 2026 | Strong savings potential, especially for homes with high afternoon and evening use. |
| SDG&E | 45.7 cents/kWh bundled residential average electric rate as of Jan. 2026 | Among the strongest solar savings cases in California because grid power is so expensive. |
| Statewide CA benchmark | About 34 cents/kWh based on EnergySage customer bills | California is far above the national average, making solar ROI stronger. |
If your utility bill feels unusually high, you are not imagining it. In PG&E territory, the utility’s January 2026 advisory showed a typical 500 kWh non-CARE residential bill of $208.68 even after a rate decrease. In SDG&E territory, the January 2026 rate alert showed a typical bundled non-CARE residential bill of $195 for only 400 kWh per month.
How Solar Panels Lower Your Electric Bill
Solar saves money in four main ways.
1. Solar powers your home directly during the day
When your solar panels are producing electricity and your home is using electricity at the same time, you avoid buying that power from the grid.
This is usually the most valuable type of solar savings.
Example:
| Solar Energy Used Instantly | Utility Rate | Value of That Solar Power |
|---|---|---|
| 10 kWh in one day | $0.40/kWh | $4.00 saved that day |
| 300 kWh in one month | $0.40/kWh | $120 saved that month |
| 3,600 kWh in one year | $0.40/kWh | $1,440 saved that year |
This is why daytime energy use matters. If you work from home, run appliances during the day, charge an EV in the daytime, or use smart energy controls, you may consume more of your solar power directly.
2. Extra solar can be exported to the grid
When your panels produce more energy than your home needs at that moment, the extra electricity goes to the grid.
Under older net metering structures, exported energy was often credited close to the retail rate. Under California’s current Net Billing Tariff, export credits are based on grid value and are usually lower than retail electricity rates. CPUC explains that onsite solar still offsets energy costs first, but exported generation is compensated at a grid-value rate instead of the same retail rate used under older NEM structures.
That is the biggest reason solar design changed after NEM 3.0.
Before, many homeowners wanted to maximize total annual production.
Now, the better strategy is usually:
- Use more solar in the home
- Store extra solar in a battery
- Avoid buying power during expensive evening hours
- Avoid oversizing a system that exports too much low-value midday energy
For more detail, see our guide to NEM 2.0 vs NEM 3.0.
3. Batteries store solar for evening peak hours
Solar panels produce the most power in the middle of the day. California utilities often charge the highest prices in the late afternoon and evening.
That mismatch is why batteries have become so important.
With a solar battery, your system can:
- Store extra midday solar
- Power your home after sunset
- Reduce evening peak-hour imports
- Improve self-consumption under NEM 3.0
- Provide backup power during outages, depending on configuration
SCE’s TOU-D-PRIME plan, for example, lists summer weekday off-peak pricing at 26 cents/kWh and on-peak pricing at 59 cents/kWh from 4 p.m. to 9 p.m. That spread creates a strong reason to store low-cost solar energy and use it during expensive evening windows.
If you are comparing battery options, read our guide to the best solar batteries for home.
4. Solar protects you from future rate increases
The savings from solar are not only based on today’s bill. They also depend on what utility rates do over the next 10, 20, and 25 years.
A solar system installed today can keep producing electricity for decades. That means every future utility rate increase makes your solar production more valuable.
This is one reason many homeowners compare solar to locking in a lower long-term cost of electricity. You still have utility rules, fixed charges, and maintenance considerations, but your roof becomes a source of electricity instead of relying entirely on the grid.
For a deeper rate outlook, see our article on whether electricity prices will go up.
The Solar Savings Formula
A simple way to estimate solar savings is:
Monthly solar savings = utility bill before solar – utility bill after solar – solar loan or lease payment, if applicable
But for a more accurate calculation, use this formula:
Annual solar value = solar kWh used at home x retail electricity rate + exported solar kWh x export credit rate + battery peak-hour savings – fixed charges and unavoidable fees
Here is what each part means:
| Factor | Meaning | Impact on Savings |
|---|---|---|
| Solar kWh used at home | Solar energy consumed instantly | Highest value |
| Retail electricity rate | What you avoid paying the utility | Higher rate = higher savings |
| Exported solar kWh | Extra solar sent to the grid | Lower value under NEM 3.0 |
| Export credit rate | What utility credits you for exports | Often much lower than retail |
| Battery savings | Stored solar used during expensive hours | Can be very valuable |
| Fixed charges | Charges solar usually cannot remove | Limits the chance of a true $0 bill |
California Bill Examples: Before and After Solar
These are simplified examples for educational purposes. Real savings depend on your roof, shading, utility plan, usage pattern, equipment, and financing.
Example 1: Average California Home
| Item | Before Solar | After Solar |
|---|---|---|
| Monthly electricity use | 750 kWh | 750 kWh |
| Effective utility rate | $0.34/kWh | $0.34/kWh |
| Monthly bill before solar | $255 | N/A |
| Solar system size | N/A | 6 kW |
| Estimated bill reduction | N/A | 60% to 75% |
| New utility bill | N/A | $65 to $105 |
| Estimated monthly savings | N/A | $150 to $190 |
| Estimated annual savings | N/A | $1,800 to $2,280 |
This is a common solar-only savings profile. The system offsets a large part of the bill, but fixed charges and nighttime usage still remain.
Example 2: PG&E Home With High Rates
PG&E’s January 2026 advisory showed an average bundled Non-CARE residential rate of 41.46 cents/kWh and a typical 500 kWh bill of $208.68.
| Item | Estimate |
|---|---|
| Monthly electricity use | 700 kWh |
| Estimated pre-solar bill at 41.46 cents/kWh | $290 |
| Solar bill reduction | 65% to 80% |
| Monthly savings | $185 to $230 |
| Annual savings | $2,220 to $2,760 |
A battery may improve savings if the home imports a lot of electricity during evening peak hours.
Example 3: SCE Home on Time-of-Use Rates
SCE’s 2026 rate advisory lists a new average residential rate of 34.5 cents/kWh, while some time-of-use plans have much higher peak prices.
| Item | Estimate |
|---|---|
| Monthly electricity use | 800 kWh |
| Estimated pre-solar bill at 34.5 cents/kWh | $276 |
| Solar-only bill reduction | 55% to 75% |
| Solar plus battery bill reduction | 70% to 90% |
| Monthly savings with solar only | $150 to $205 |
| Monthly savings with solar plus battery | $190 to $250 |
This is where load shifting matters. If your home uses a lot of electricity from 4 p.m. to 9 p.m., a battery can make a major difference.
Example 4: SDG&E Home
SDG&E’s January 2026 bundled residential average electric rate increased to 45.7 cents/kWh, with a typical bundled non-CARE residential bill of $195 for 400 kWh.
| Item | Estimate |
|---|---|
| Monthly electricity use | 650 kWh |
| Estimated pre-solar bill at 45.7 cents/kWh | $297 |
| Solar-only bill reduction | 60% to 80% |
| Solar plus battery bill reduction | 70% to 90% |
| Monthly savings with solar only | $175 to $235 |
| Monthly savings with solar plus battery | $210 to $265 |
In SDG&E territory, even moderate usage can produce large bills, so solar savings can be strong.
How Much Can You Save by Solar System Size?
System size matters, but bigger is not always better. Under NEM 3.0, the goal is not simply to install the largest possible system. The goal is to design a system that matches your actual consumption and reduces expensive grid imports.
| Solar System Size | Typical Home Fit | Estimated Annual Production in Sunny CA Areas | Gross Annual Value at $0.34/kWh if Used Onsite |
|---|---|---|---|
| 4 kW | Smaller home, efficient household | 5,600 to 6,800 kWh | $1,900 to $2,300 |
| 5 kW | Small to average home | 7,000 to 8,500 kWh | $2,380 to $2,890 |
| 6 kW | Average home | 8,400 to 10,200 kWh | $2,860 to $3,470 |
| 8 kW | Larger home | 11,200 to 13,600 kWh | $3,810 to $4,620 |
| 10 kW | Large home, EV, pool, or heat pump | 14,000 to 17,000 kWh | $4,760 to $5,780 |
PVWatts, a DOE laboratory-backed calculator, is commonly used to estimate solar production for grid-connected PV systems based on location, system size, tilt, azimuth, losses, and historical weather variability.
Important note: the “gross annual value” above assumes solar energy is used at home at the retail rate. Under NEM 3.0, exported solar is usually worth less than energy used directly. That is why a battery or smarter load timing can increase real savings.
Solar-Only vs Solar Plus Battery Savings
In California, solar-only systems can still save money, but batteries often make the math stronger under NEM 3.0.
Solar-only savings profile
Solar-only works best when:
- You use a lot of electricity during the day
- Your roof gets strong sun exposure
- Your system is not oversized
- Your household can shift appliances to daytime hours
- Your electricity rate is high enough to support fast payback
Typical solar-only savings:
| Metric | Solar-Only Estimate |
|---|---|
| Bill reduction | 45% to 75% |
| Best for | Daytime usage homes |
| Weakness | More exports at lower credit value |
| Payback impact | Good, but more sensitive to NEM 3.0 |
| Backup power | No, unless paired with storage and proper equipment |
Solar plus battery savings profile
Solar plus battery works best when:
- You are under NEM 3.0
- You have high evening usage
- You are on time-of-use rates
- You want outage backup
- You want to reduce grid imports as much as possible
Typical solar plus battery savings:
| Metric | Solar + Battery Estimate |
|---|---|
| Bill reduction | 60% to 90% |
| Best for | Evening usage, TOU rates, NEM 3.0 |
| Weakness | Higher upfront cost |
| Payback impact | Can improve savings, but depends on battery price |
| Backup power | Yes, if configured for backup |
The CPUC specifically notes that customer-generators can maximize bill savings under the Net Billing Tariff by installing battery storage with generation, because stored energy can be used or exported during higher-value hours.
Will Solar Panels Eliminate Your Electric Bill?
Sometimes, but not usually.
A true $0 electric bill is harder to achieve today than it was under older net metering rules. Most solar customers should expect a smaller utility bill, not necessarily no utility bill.
Why?
1. Fixed charges still apply
California’s new fixed charge structure separates some grid infrastructure costs into a flat monthly line item. The CPUC fact sheet says the flat rate is $24.15 per month, with discounted rates of $6 for CARE customers and $12 for FERA-qualified customers.
The CPUC also says all residential customers, including rooftop solar customers, transition to flat rates because solar customers still rely on grid infrastructure.
2. You still use grid power at night
Unless you have enough battery storage, your home usually imports electricity after sunset.
3. Winter production is lower
Solar panels produce less in winter because days are shorter and the sun angle is lower.
4. Export credits are lower under NEM 3.0
If your system exports a lot of midday solar, those exports may not offset your evening grid purchases dollar for dollar.
5. Utility billing rules vary
Your bill may include non-bypassable charges, minimum charges, delivery charges, taxes, and other line items that solar may not fully offset.
How NEM 3.0 Changed Solar Savings
NEM 3.0 did not make solar worthless. It changed the way solar saves money.
Under older NEM rules, exporting energy was more valuable. Under the current Net Billing Tariff, using solar directly in the home is the core savings engine.
| Solar Billing Feature | Older Net Metering | NEM 3.0 / Net Billing Tariff |
|---|---|---|
| Solar used at home | Offsets retail electricity | Still offsets retail electricity |
| Solar exported to grid | Often credited near retail rate | Credited based on avoided cost / grid value |
| Best system design | Annual production offset | Self-consumption optimization |
| Battery value | Helpful but optional | Often much more important |
| Payback driver | Total kWh production | Timing, self-use, storage, and rates |
The CPUC says new interconnection customers after April 15, 2023 generally take service under the Net Billing Tariff, which investor-owned utilities call the Solar Billing Plan.
How Much Do Solar Panels Cost Compared With Bill Savings?
The cost of solar panels matters because your real financial return depends on both sides of the equation:
- What your system costs
- How much electricity it offsets
- Whether you add a battery
- Whether you finance, lease, or pay cash
- Your utility rate
- Future rate increases
EnergySage reports that as of May 2026, the average California solar panel system costs about $2.53 per watt, or $22,284 for an average 8.81 kW system before incentives.
For a full cost breakdown, see our guide to solar panel installation cost and our California-specific guide to how much solar panels cost in California.
Important 2026 tax credit update
For homeowners purchasing residential solar, the federal Residential Clean Energy Credit changed. The IRS says the credit equals 30% for qualified clean energy property installed from 2022 through December 31, 2025, and is not available for property placed in service after December 31, 2025. IRS guidance on the OBBB also states that the Section 25D Residential Clean Energy Credit is not allowed for expenditures made after December 31, 2025.
Because tax rules can change and depend on your specific situation, homeowners should confirm details with a qualified tax professional.
Simple Payback Example
Let’s say a California homeowner installs a 7 kW solar system.
| Item | Estimate |
|---|---|
| Gross solar installation cost | $17,500 to $23,000 |
| Annual electric bill before solar | $3,000 |
| Estimated annual savings | $1,800 to $2,400 |
| Simple payback | About 7 to 11 years |
| Savings after payback | Mostly long-term energy savings for the remaining system life |
A battery will increase upfront cost, but it can also increase savings under time-of-use rates and NEM 3.0 if it helps avoid expensive peak-hour power.
For personalized ROI math, use our solar ROI calculator.
What Factors Affect How Much Solar Panels Save?
1. Your current electric bill
Solar savings are usually strongest when your current bill is high.
A $90/month bill may not produce enough savings to justify a large system.
A $300/month bill gives solar more room to reduce costs.
2. Your electricity rate
The higher your rate, the more valuable solar becomes.
A homeowner paying 45 cents/kWh can save much more from the same solar production than a homeowner paying 15 cents/kWh.
3. Your roof sunlight
Solar savings are strongest when your roof has:
- Strong sun exposure
- Minimal shading
- South, west, or southwest-facing roof planes
- Enough usable space
- Good roof condition
If your roof is shaded or aging, you may need tree trimming, a different design, or roof work before installation.
4. Your system size
Undersizing leaves savings on the table.
Oversizing can create too much low-value exported solar under NEM 3.0.
The best system size is based on:
- Last 12 months of kWh usage
- Utility rate plan
- Future EV charging
- Future heat pump or electrification plans
- Battery storage
- Roof layout
- Export rules
5. Your daily usage pattern
Homes that use more electricity during the day tend to get more direct solar value.
Good daytime loads include:
- Pool pumps
- EV charging
- Laundry
- Dishwashers
- Heat pump water heaters
- Home office equipment
- Pre-cooling before peak hours
6. Battery storage
A battery can improve savings by turning midday solar into evening power.
This is especially useful when the utility charges high rates from 4 p.m. to 9 p.m.
7. Financing terms
If you finance solar, compare:
- Monthly loan payment
- Monthly utility savings
- Interest rate
- Dealer fees
- Escalators, if lease or PPA
- Ownership terms
- Warranty coverage
A system can save money from month one if the post-solar utility bill plus solar payment is lower than the old utility bill.
For payment options, read our guide to California solar financing.
8. Equipment quality
Higher-efficiency panels can generate more energy from limited roof space. Better inverters and monitoring can improve long-term performance. Strong warranties can also protect your savings over time.
9. Utility rate changes
Future rate increases can improve solar savings because every kWh your system produces becomes more valuable.
10. Maintenance and degradation
Solar panels slowly degrade over time, but high-quality panels are designed to keep producing for 25 to 30 years. Maintenance costs are usually modest, especially compared with ongoing utility bills.
How to Maximize Solar Savings
Here is the practical playbook for homeowners in 2026.
1. Start with your last 12 months of electric bills
Do not size solar based only on your most recent bill.
Use 12 months because it shows:
- Summer air conditioning spikes
- Winter usage changes
- EV charging patterns
- Total annual kWh
- Seasonal bill differences
2. Design around self-consumption
Under NEM 3.0, the goal is to use more solar power inside the home.
Smart ways to do that:
- Run major appliances during solar production hours
- Charge EVs during the day when possible
- Use timers for laundry and dishwashing
- Pre-cool the home before peak hours
- Add a battery if evening usage is high
3. Compare solar-only and solar plus battery
Do not assume the battery is automatically worth it.
Ask for both proposals:
- Solar-only savings
- Solar plus battery savings
- Backup capability
- Battery size
- Estimated self-consumption
- Payback difference
4. Avoid oversized systems with too much export
A larger system is not always a better system.
If the extra panels mainly produce low-value exported energy, your payback may get worse.
5. Make sure your quote includes realistic production
A good solar proposal should show:
- Estimated annual production
- Monthly production estimate
- Utility rate assumptions
- Net billing assumptions
- Shading analysis
- Degradation assumptions
- Battery operating mode, if included
See our guide on how to compare solar panel quotes before signing anything.
6. Think ahead about EVs and electrification
If you plan to add an EV, heat pump, induction stove, or heat pump water heater, your future electricity usage may be higher than your past usage.
That can make solar more valuable, but only if the system is designed with future load in mind.
Solar Energy Pros and Cons for Electric Bill Savings
Solar is not perfect for every home. Here is the honest breakdown.
| Pros | Cons |
|---|---|
| Can reduce monthly electric bills by 50% to 90% | Savings vary by roof, utility, and rate plan |
| Protects against future rate increases | Upfront cost can be significant |
| Strong value in high-rate states like California | NEM 3.0 reduced export credit value |
| Battery storage can reduce peak-hour costs | Batteries add cost |
| Can increase energy independence | Fixed charges may remain |
| Long equipment life, often 25+ years | Roof condition matters before installation |
| Lower carbon footprint | Not every roof has enough sun |
For homeowners with high bills, strong sun exposure, and long-term plans to stay in the home, the pros often outweigh the cons.
Is Solar Worth It If My Bill Is Only $100 Per Month?
Maybe, but the math is tighter.
If your bill is around $100/month, your annual electric cost is only about $1,200. A small solar system may still make sense if your roof is ideal and you expect rates to rise, but the payback period will usually be longer.
Solar tends to work best for homeowners who:
- Pay at least $150 to $200/month for electricity
- Have high kWh usage
- Expect to stay in the home for several years
- Have a sunny roof
- Want backup power or battery storage
- Plan to add an EV or electrify appliances
Is Solar Worth It If My Bill Is $300+ Per Month?
Usually, yes.
A $300/month electric bill equals $3,600 per year. If solar reduces that by 70%, that is about $2,520 per year in savings.
Over 20 years, that is more than $50,000 in avoided electricity costs before accounting for future utility rate increases.
This is why high-bill California homeowners are often strong solar candidates.
How to Estimate Your Own Solar Savings in 5 Minutes
Use this simple method.
Step 1: Find your annual kWh usage
Look at your utility bill or online account.
Example: 10,000 kWh/year
Step 2: Find your average electricity rate
Divide your annual electric cost by annual kWh.
Example:
$3,800 annual electric cost / 10,000 kWh = $0.38/kWh
Step 3: Estimate how much solar can offset
A properly designed system might offset 60% to 90% of your usage-based charges, depending on NEM 3.0, battery storage, roof space, and usage timing.
Example:
$3,800 x 70% = $2,660/year in estimated savings
Step 4: Subtract unavoidable charges
If fixed charges, taxes, or minimum bills total $25 to $40/month, subtract that from your expectations.
Example:
$30/month x 12 = $360/year in unavoidable utility costs
Step 5: Compare savings to system cost
If your net system cost is $22,000 and your annual savings are $2,600, simple payback is about 8.5 years.
FAQs About Solar Panel Electric Bill Savings
How much do solar panels save per month?
Most homeowners save about $100 to $300 per month, but high-usage homes in expensive utility territories can save more. In California, savings are often stronger because electricity rates are high.
Do solar panels reduce your electric bill to zero?
Sometimes, but most homeowners should expect a reduced bill rather than a $0 bill. Fixed charges, nighttime usage, winter imports, and NEM 3.0 export rules can leave some utility costs in place.
How much do solar panels save in California?
Many California homeowners save $1,500 to $4,000+ per year, depending on utility rates, system size, usage, and whether they add battery storage. PG&E, SCE, and SDG&E customers often see strong savings because their electricity rates are high.
Are solar panels still worth it under NEM 3.0?
Yes, but system design matters more. Solar used directly in the home is usually more valuable than exported solar. Batteries, daytime energy use, and correct system sizing are now more important.
Do batteries increase solar savings?
Often, yes. Batteries can store excess solar and discharge during expensive evening hours. This can improve savings under time-of-use rates and NEM 3.0, especially in California.
How long does it take for solar panels to pay for themselves?
Many California homeowners see payback in roughly 7 to 11 years, but the range depends on system cost, utility rates, financing, battery storage, and electric usage.
What is the biggest factor in solar savings?
Your electricity rate is one of the biggest factors. The higher your cost per kWh, the more valuable each solar kWh becomes.
Is solar worth it for low electric bills?
If your bill is under $100/month, solar may still work, but the payback is usually longer. Solar tends to be more attractive for homes with higher monthly bills.
How do I know if my solar quote is fair?
Compare the cost per watt, equipment quality, warranty, production estimate, financing terms, and battery assumptions. You can start with our guide on how to compare solar panel quotes.
Final Thoughts: How Much Will Solar Save You?
Solar panels can save a little or a lot, depending on your home.
For a low-usage home, solar may save $50 to $100 per month.
For an average California home, solar may save $150 to $250 per month.
For a high-usage home with SDG&E, PG&E, or SCE bills, solar plus battery storage can sometimes save $250 to $500+ per month.
The key is not just installing panels. The key is designing the right system for your bill, your utility rate, your roof, your usage pattern, and California’s current net billing rules.
If you want a personalized estimate, start with NRG Clean Power’s solar savings calculator or review your options with our team through the solar installation page.