
Solar pricing is still confusing for homeowners because there is no single national number that tells the whole story. Some sources use quoted marketplace prices. Others use installed prices reported after the fact. Some averages include loan dealer fees. Others reflect cash purchases only. Add in roof complexity, battery storage, local permitting, utility rules, and state incentives, and it is easy to see why two homes can get very different quotes.
The good news is that solar is still one of the strongest long term energy upgrades for many homeowners. The key is understanding what you should actually expect to pay in 2026 and how to tell a fair quote from an overpriced one.
Quick answer
For most U.S. homeowners in 2026:
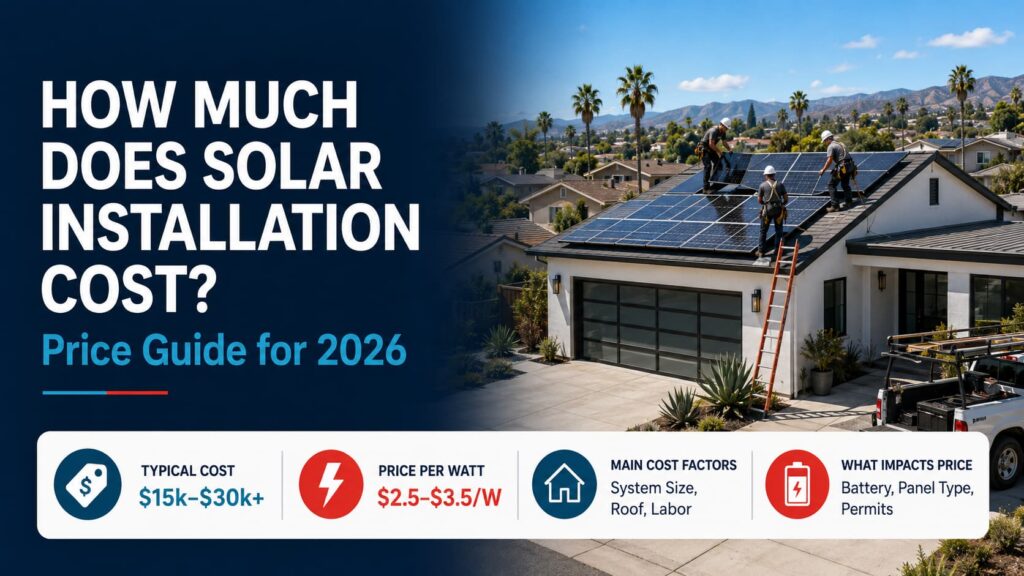
- A typical home solar system costs about $15,000 to $36,000+ before incentives, depending mostly on system size, equipment, roof complexity, and location.
- On competitive marketplace data, many quotes land around $2.58 to $2.75 per watt, with the EnergySage marketplace average near $2.58 to $2.60 per watt in early 2026.
- On broader installed-price data, the national median for cash-purchased residential solar is meaningfully higher, around $3.50 per watt, per Lawrence Berkeley National Laboratory’s most recent report.
- Loan-financed systems often look more expensive upfront because dealer fees are frequently rolled into the total contract price.
- The biggest national policy change: the federal residential clean energy credit (Section 25D) no longer applies to homeowner-owned systems placed in service after December 31, 2025.
That last point matters. A lot of outdated articles still tell homeowners to subtract 30% from the final price. For most homeowner-owned systems installed in 2026, that is no longer the right assumption. We cover the full incentive picture in our 2026 California solar tax credit guide.
What is the average cost of solar installation in 2026?
The most practical way to think about price is cost per watt.
Formula: System cost = system size in watts × price per watt
So if your home needs an 8 kW system and your quote is $2.61 per watt: 8,000 × $2.61 = $20,880. That is the pre-incentive contract price.
Typical 2026 solar cost by system size
| System size | Typical cost per watt | Estimated cost before incentives |
|---|---|---|
| 4 kW | $2.86/W | $11,440 |
| 5 kW | $2.75/W | $13,750 |
| 6 kW | $2.66/W | $15,960 |
| 7 kW | $2.59/W | $18,130 |
| 8 kW | $2.61/W | $20,880 |
| 9 kW | $2.55/W | $22,950 |
| 10 kW | $2.55/W | $25,500 |
| 11 kW | $2.56/W | $28,160 |
| 12 kW | $2.52/W | $30,240 |
| 13 kW | $2.50/W | $32,500 |
| 14 kW | $2.51/W | $35,140 |
| 15 kW | $2.44/W | $36,600 |
The average system installed in the U.S. is roughly 12 kW, which lands near $30,500 before incentives on marketplace data. For a size-specific breakdown, see our dedicated guides for 5 kW, 10 kW, and 15 kW systems.
What size system do most homes need?
Many U.S. homes land somewhere between 6 kW and 12 kW, but the right answer depends on your annual electricity usage, whether you have an EV, whether you use electric heat or a heat pump, pool equipment, future electrification plans, and your roof space and shading.
A large house is not always the same thing as a large solar system. A small efficient home with gas appliances may need less solar than a moderate-size all-electric home with EV charging. If you want to size it by home footprint, our guides on solar for a 2,000 sq ft home and 1,000 sq ft home work through the math.
Why solar cost averages vary so much online
One of the biggest mistakes homeowners make is comparing two articles that are measuring completely different things.
1. Marketplace quote data vs installed price data
A marketplace average reflects quotes shoppers receive from competing installers. An installed-price study reflects completed projects reported across a much broader market. Those numbers are both useful, but they are not interchangeable. The gap is real: EnergySage marketplace quotes average about $2.58 per watt, while Lawrence Berkeley National Laboratory’s installed-price data puts the 2024 cash-purchase median near $3.50 per watt. That roughly one-dollar-per-watt difference is largely the difference between a competitive online marketplace and what many homeowners encounter when a single installer knocks on the door.
2. Cash price vs loan price
This is the single most overlooked cost issue in residential solar. A loan-financed solar system can carry a much higher upfront contract price than an equivalent cash purchase because dealer fees are often embedded in the financed amount. A homeowner may see two quotes for the exact same roof and the exact same equipment, but the financed contract price looks much higher before any monthly payment discussion even begins.
3. State averages can be misleading
A low price per watt does not always mean a lower total project cost. Hotter states often have lower per-watt pricing, but homeowners there may need larger systems because air conditioning loads are heavier. A colder state may show a higher price per watt, yet a similar overall contract price if the home needs fewer panels.
Solar cost by state in 2026
Solar pricing varies widely by state because of labor rates, permitting and interconnection costs, installer competition, market maturity, average system size, utility rules, local incentives, and financing patterns. State-level per-watt pricing in 2026 ranges from roughly $2.35 in the most competitive markets like Texas to over $3.15 in states like New Hampshire.
| State | Avg. system cost before incentives | Avg. cost per watt | Estimated 25-year savings |
|---|---|---|---|
| Arizona | $28,555 | $2.09/W | $42,527 |
| California | $22,671 | $2.48/W | $134,412 |
| Colorado | $30,116 | $2.83/W | $30,598 |
| Connecticut | $30,802 | $2.75/W | $102,993 |
| Florida | $34,671 | $2.20/W | $52,135 |
| Hawaii | $28,228 | $3.23/W | $44,962 |
| Massachusetts | $35,042 | $3.17/W | $155,618 |
What these state examples actually tell us
A few patterns stand out. California’s per-watt price is not the lowest, but long term savings can still be huge because electricity is expensive and utility rates matter. Arizona and Florida can have attractive per-watt pricing, but system sizes are often larger because cooling demand is high. Massachusetts and Connecticut can be more expensive upfront, yet strong utility rates and local policy support can make solar economics compelling. Hawaii still tends to be expensive per watt, but its electricity costs can make solar attractive.
This is why homeowners should never judge value using price alone. The real question is: how much electricity will this system replace, and what is that electricity worth where I live? In California specifically, the answer is a lot, which is why we maintain a separate California solar cost guide.
The biggest 2026 update: the federal tax credit changed
Many articles still say homeowners can claim a 30% federal tax credit on a newly installed solar system. That was true for many systems placed in service through the end of 2025. It is not the default assumption for customer-owned residential systems installed in 2026.
What changed
For most homeowner-owned systems placed in service in 2026, the federal residential clean energy credit (Section 25D) is no longer available, the old 30% assumption should not be used in quote comparisons, and state, utility, and local incentives now matter even more.
There is one important exception. The commercial clean energy credit, Section 48E, survives, and homeowners can still benefit from it indirectly through third-party ownership. When a company owns the system through a lease, PPA, or prepaid product, it can claim the 48E credit and price the benefit into your payments. That makes third-party ownership the only remaining route to federal solar money in 2026, and it changes the old buy-versus-lease calculus. Our solar lease vs buy vs PPA guide works through when each makes sense now.
What this means for shopping in 2026
If you are comparing a fresh 2026 quote against an old blog post written in 2023, 2024, or early 2025, be careful. That older article may understate your real net cost because it assumes a federal tax credit that many 2026 homeowner-owned projects no longer qualify for. That does not automatically mean solar is a bad investment. It means your economics now depend more heavily on utility electricity rates, your self-consumption, export compensation rules, local rebates, property tax exemptions, and whether you buy with cash, use a loan, or choose third-party ownership.
What actually drives your solar installation cost?
1. System size
Still the biggest cost driver. A larger system means more panels, racking, wiring, labor, and sometimes a larger inverter setup. But larger systems also often benefit from a slightly lower price per watt.
2. Financing method
A cash quote and a loan quote can look very different. Cash purchase usually produces the cleanest apples-to-apples comparison. Solar loans reduce upfront cash needs, but interest and dealer fees can reduce long term savings. Leases and PPAs lower the entry barrier and, in 2026, are the way to capture the 48E credit, but lifetime savings are usually lower than ownership.
3. Roof complexity
The easiest roofs are the cheapest roofs for solar. A higher quote is more likely with multiple roof planes, dormers and skylights, steep pitch, tile or fragile roofing materials, heavy shading, a long conduit run, or limited space that requires premium high-efficiency equipment.
4. Equipment selection
Premium panels, microinverters, battery-ready designs, critter guards, upgraded monitoring, and premium workmanship guarantees can all increase cost. That is not necessarily bad. A quote can be more expensive and still be the better value.
5. Location and local permitting
Soft costs remain a major part of solar pricing. Permits, inspections, utility approvals, overhead, and customer acquisition all affect what you pay.
6. Electrical work
Some homes need a main panel upgrade, a subpanel, service changes, rewiring, trenching, or roofing prep. A main panel upgrade alone commonly adds $2,500 to $4,500, so ask any installer to confirm whether yours is required before you sign.
7. Battery storage
Adding a battery meaningfully increases total cost, but it also changes the value proposition. You are no longer paying only for bill savings. You are also paying for resilience, outage protection, and in some markets better time-of-use optimization.
How much does a solar battery add in 2026?
Battery storage is no longer a niche add-on. In many markets, especially where export credits are weak or outages are more common, batteries are becoming part of the mainstream conversation. A typical residential battery setup in 2026 often centers around 13.5 kWh of storage and adds roughly $10,000 to $13,000 installed. For many homeowners that is enough to keep essential circuits running during an outage, though it is usually not enough to back up a large all-electric house indefinitely. Full detail is in our solar battery cost guide and our best home solar batteries roundup.
When batteries make the most sense
A battery is usually easier to justify when outages are frequent or costly, your utility export rate is low, you want backup for medical devices, refrigeration, internet, or security systems, or you are in a market where evening peak rates are much higher than midday energy value. In California, the split matters: on NEM 3.0 utilities (PG&E, SCE, SDG&E) low export rates make batteries close to essential, while on municipal utilities like LADWP and SMUD that still pay retail net metering, a battery is more of a backup choice than a financial requirement. Our Granada Hills rate guide shows why.
When a battery may be harder to justify
A battery can be harder to justify on simple payback alone when your utility still offers strong net metering or export credits, you rarely lose power, or your only goal is the fastest financial ROI.
Where your solar money actually goes
One of the most useful 2026 pricing insights is that the panels themselves are only a small slice of total installation cost.
Typical cost breakdown for a 12 kW residential system
| Cost component | Average cost | Share of total cost |
|---|---|---|
| Solar panels | $3,801 | 12% |
| Inverter(s) | $3,111 | 10% |
| Racking equipment | $1,037 | 3% |
| Electrical wiring | $2,650 | 9% |
| Supply chain costs | $2,765 | 9% |
| Sales tax | $691 | 2% |
| Installation labor | $2,074 | 7% |
| Sales and marketing | $5,531 | 18% |
| Overhead | $3,226 | 11% |
| Installer profit | $3,226 | 11% |
| Permitting and interconnection | $2,421 | 8% |
Why this matters
Homeowners often focus almost entirely on the panel brand. But in reality, a big portion of the project cost comes from labor and project execution, engineering and permitting, sales and customer acquisition, overhead and business operations, and utility interconnection. According to SEIA’s market data, actual equipment makes up only about one-third of the total average cost of residential solar. That is why two systems using similar panels can still have very different total prices, and why choosing a transparent installer matters more than chasing one brand of panel.
What type of solar panel should homeowners choose in 2026?
For most homes in 2026, the real answer is simple: monocrystalline panels remain the default choice.
Monocrystalline panels
Best for most homes because they offer the highest efficiency among mainstream residential options, better use of limited roof space, cleaner aesthetics, and stronger output per panel. Premium residential panels now commonly push past 22.5% efficiency, though the highest-efficiency module is not always the best value for every roof. If roof space is not tight, a mid-tier monocrystalline panel is often the smarter value.
Polycrystalline panels
Polycrystalline panels still exist but are far less central to today’s residential market. They may still appeal when upfront equipment price matters most, roof space is abundant, and maximum efficiency is not the priority.
Thin-film panels
Thin-film panels are usually not the first choice for a standard residential rooftop. They are more relevant for RVs, portable applications, specialty surfaces, and projects where flexibility and weight matter more than efficiency.
Is solar still worth it in 2026?
For many homeowners, yes. But the reasons are now a little more local and a little less federal.
Solar tends to be worth it when you own your home, your roof gets good sun, your electric bill is high, you expect to stay in the home for years, your quote is competitive, your utility rates are rising, and your state or utility still offers meaningful incentives.
Solar tends to be less attractive when your roof is heavily shaded, you will move very soon, your electric usage is low, your utility rates are already very cheap, or your quote is bloated by poor financing terms.
What about payback?
A useful rule of thumb is that many homeowners historically landed around 10 years for simple solar payback, though in high-rate states the figure is lower. In California, high electricity rates push typical payback to roughly 5 to 7 years even without the federal credit. Payback matters less than most people think for a system that lasts 25 to 30 years; our guide on how long solar panels last explains why the two decades after payback are close to free electricity.
Does solar increase home value?
It often can, especially when the system is owned, not leased. Research on California sales found owned solar added roughly 5 to 10 percent to home value, while leased systems added little because the buyer has to assume the contract. Resale value depends on local utility rates, the age and condition of the system, whether the buyer understands the savings, and whether the system is owned free and clear. We cover the data in our do solar panels increase home value guide.
How to estimate the right solar system size for your house
The easiest starting point is your last 12 months of electric bills.
Step 1: Add up annual electricity use. Find your total yearly usage in kWh. Example: January through December total usage = 12,000 kWh.
Step 2: Estimate the production factor for your area. A rough planning shortcut is that U.S. rooftop solar often produces around 1,100 to 1,600 kWh per year per installed kW, depending on climate, orientation, shading, and system design.
Step 3: Divide usage by annual production per kW. Example: 12,000 kWh ÷ 1,300 kWh per kW = 9.2 kW, suggesting a system around 9 to 10 kW.
This is only a planning estimate. A real proposal should also account for roof azimuth and pitch, shading analysis, module degradation assumptions, future EV charging, heat pump conversion, and export rules. Our guide on how many kWh per day is normal helps you sanity-check your usage.
How to tell if your solar quote is fair in 2026
A fair quote usually has a clearly stated system size in kW, the price per watt shown or easy to calculate, modeled annual production in kWh, equipment brands and model numbers, warranty details for equipment, workmanship, and roof penetrations, an honest financing breakdown, panel layout and shading assumptions, and a clear timeline for permitting and interconnection.
Red flags include no production estimate, no equipment model numbers, pressure to sign immediately, a loan quote with no dealer fee disclosure, a very high price per watt with no reason given, vague warranty language, savings projections based on unrealistic utility inflation assumptions, and heavy emphasis on monthly payment instead of total project cost.
Before signing with anyone, verify the contractor’s license. In California you can check any installer on the CSLB license lookup. NRG Clean Power holds California license #1026168 and has installed statewide for over 30 years.
Ways to lower your solar installation cost
You do not always need the absolute cheapest quote. You need the best value. Smart ways to reduce cost without wrecking ROI:
- Get multiple quotes. Still the fastest way to spot inflated pricing.
- Compare cash and financed pricing separately. Do not let dealer fees hide inside the contract.
- Avoid overbuying premium panels if your roof has plenty of usable space.
- Skip the battery if your goal is pure payback and your utility rules are still favorable.
- Bundle needed electrical work carefully and make sure it is actually required.
- Replace an aging roof before solar if needed, instead of paying to remove and reinstall panels later.
- Use local incentive databases like DSIRE to check for rebates, tax exemptions, and utility programs.
Frequently asked questions
How much does solar installation cost for a typical house in 2026?
For many homes, the total price falls somewhere between about $16,000 and $31,000 before incentives, with the average 12 kW system near $30,500. Larger homes, premium equipment, batteries, and complex roofs can push the number higher.
What is a good price per watt for residential solar in 2026?
Competitive marketplace pricing often lands around $2.58 to $2.75 per watt, while broader installed-price data runs closer to $3.50. A fair quote depends on whether it is cash or financed, what equipment is included, and how difficult the installation is.
Why is my loan quote so much higher than the cash quote?
Because dealer fees are often rolled into the contract price for financed systems. Compare cash price, financed price, APR, dealer fees, and total paid over time before signing.
Is there still a 30% federal tax credit in 2026?
Not for homeowner-purchased systems. Section 25D expired December 31, 2025. Only the commercial 48E credit remains, which homeowners can access indirectly through a lease or PPA. Systems installed in 2025 can still claim the credit on a 2025 return.
Is solar cheaper in California than other states?
Not always on a pure per-watt basis. California sits near the middle of the pack on installed pricing, but it produces excellent long term savings because electricity is expensive, often paying back in 5 to 7 years.
Is a battery worth adding?
Sometimes. It is easiest to justify when you care about backup power, face weak export credits under NEM 3.0, or live in a time-of-use market where shifting energy into the evening has real value.
Are solar panels themselves the main cost?
No. Panels are only about one-third of the total job. Labor, inverter choice, permitting, overhead, electrical work, and customer acquisition all contribute heavily to the final price.
The bottom line
In 2026, the right way to think about solar cost is not just “How much do panels cost?” It is: how large a system do I actually need, how much am I paying per watt, is this a cash quote or a loan quote with fees built in, what does my utility pay for exported solar, are there still local incentives available where I live, and does a battery improve my economics or just add backup value?
For many homeowners, solar still works financially. But in 2026, a smart decision depends more than ever on local electricity prices, local incentives, and honest quote comparison. The homeowners who do best are usually not the ones who chase the lowest sticker price. They are the ones who understand the numbers, size the system correctly, and compare quotes on a true apples-to-apples basis.
Ready for a transparent, no-pressure number? Our instant quote takes about two minutes, and our consultations are 100 percent virtual, with no door-knocking.