Solar panels are quietly transforming rooftops around the world, turning sunlight into electricity and helping homeowners slash utility bills. If you’re thinking about going solar, one of your biggest questions is likely: how much electricity can a solar panel actually produce? This in-depth guide breaks down the numbers, the factors that influence output, and how to calculate what you can expect.
Quick Takeaways
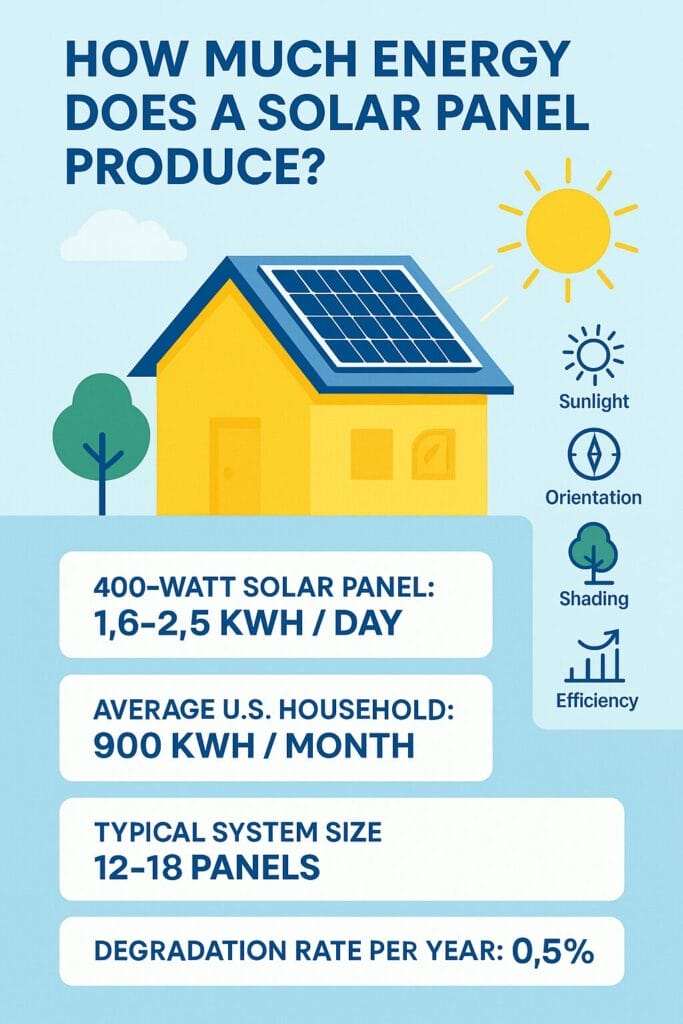
- Solar panels degrade slowly, losing about 0.5% output per year, and often last 25–30 years or more.
- Most residential panels in 2025 are rated 250–550 watts, with 400-watt models becoming the new standard.
- A 400-watt panel can generate roughly 1.6–2.5 kWh of energy per day, depending on local sunlight.
- To cover the average U.S. household’s 900 kWh/month consumption, you typically need 12–18 panels.
- Output depends on sun hours, roof direction, panel technology, shading, temperature and age.
Solar Panel Output Calculator
Enter your panel wattage, average peak sun hours per day and number of panels to estimate production.
Power vs. Energy: Know the Difference
Power (watts) measures instantaneous output. Energy (kilowatt‑hours, or kWh) measures electricity produced over time. Solar panels are rated by their peak DC power under ideal test conditions. Homeowners use AC electricity, so inverters convert DC to AC with a small efficiency loss (around 3–5%).
Typical Solar Panel Power Ratings
Over the past decade, panel wattage has climbed steadily. Here’s a snapshot of what’s common now:
- 250–300 W: Older or budget-friendly modules.
- 350–400 W: Standard panels installed between 2019–2023.
- 400–450 W: Mainstream in 2024–2025 and considered “standard.”
- 500+ W: Premium or commercial-grade panels offering higher output, often paired with advanced cell technologies.
High-output panels are matched by improved efficiencies. Monocrystalline panels achieve 22–27% efficiency, while polycrystalline panels are generally lower (15–22%). Thin-film panels remain useful for portable or flexible applications but produce less power per square meter.
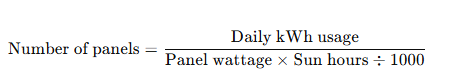
How to Calculate Solar Energy Production
To estimate daily energy production from a single panel, a simple formula can be used:
- Panel Wattage: Look for your panel’s rated output (e.g., 400 W).
- Peak Sun Hours: The number of hours when sunlight intensity averages 1,000 W/m². Varies by location:
- Northern regions: 2–4 h/day
- Central U.S.: 4–5 h/day
- Southwest deserts: 6–8 h/day
- Divide by 1,000 to convert watt-hours to kilowatt-hours.
Example: A 400 W panel with 4.5 peak sun hours:
- 400 W × 4.5 h = 1,800 Wh
- 1,800 ÷ 1,000 = 1.8 kWh/day
- Multiply by 30 for monthly output: ≈ 54 kWh/month
Monthly Energy Production Estimates by Region
The United States spans a diverse range of climates and solar resources. Your location plays a big role in how many peak sun hours you can expect.
California (e.g., Los Angeles) Southern California is known for its abundant sunshine. You might see 5.5-6 peak sun hours per day. Using the 400W example:
Daily production: 400W x 5.5 hours = 2,200 Wh or 2.2 kWh/day
Monthly production (~30 days): 2.2 kWh x 30 ≈ 66 kWh/month per panel
Using the same formula, here’s a breakdown of how solar panel energy production can vary across different U.S. regions, based on their average peak sun hours:
| Location | Peak Sun Hours | Daily Production (400W) | Monthly Production (400W) |
| California (Los Angeles) | 5.5 – 6 | 400W x 5.5 hrs = 2,200 Wh (2.2 kWh/day) | 2.2 kWh/day x 30 ≈ 66 kWh/month |
| Northeast (Boston) | ~4 | 400W x 4 hrs = 1,600 Wh (1.6 kWh/day) | 1.6 kWh/day x 30 ≈ 48 kWh/month |
| Southwest (Phoenix) | 6 – 7 | 400W x 6.5 hrs = 2,600 Wh (2.6 kWh/day) | 2.6 kWh/day x 30 ≈ 78 kWh/month |
| Pacific Northwest (Seattle) | 3 – 4 | 400W x 3.5 hrs = 1,400 Wh (1.4 kWh/day) | 1.4 kWh/day x 30 ≈ 42 kWh/month |
These are rough estimates, of course. Actual production will vary with seasonal changes, roof orientation, shading, and weather patterns.
Daily and Monthly Output Examples
Use the table below to see how different wattages and sun hours affect production:
Panel Size Sun Hours Daily Output Monthly Output* 300 W 3 h 0.9 kWh 27 kWh 300 W 5 h 1.5 kWh 45 kWh 400 W 4 h 1.6 kWh 48 kWh 400 W 6 h 2.4 kWh 72 kWh 500 W 4 h 2.0 kWh 60 kWh 500 W 7 h 3.5 kWh 105 kWh *Monthly outputs are approximate. Weather, shading and seasonal variations can change actual production.
Factors Affecting Solar Panel Output
Sunlight Availability
- Peak sun hours depend on latitude, climate and season.
- Desert states like Arizona or Nevada can see over 7 sun hours a day.
- Cloudier or northern regions might average 2–4 sun hours.
Panel Technology
- Monocrystalline: Highest efficiency, better in low light and high temperatures, but pricier.
- Polycrystalline: More affordable, slightly lower efficiency.
- Thin-Film: Lightweight and flexible, suited for portable uses, but less efficient and may degrade faster.
Roof Orientation and Tilt
- South-facing roofs in the Northern Hemisphere capture the most sunlight.
- East or west orientations reduce output by about 10–20%.
- Tilt angles close to the site’s latitude optimize year-round generation.
Shading and Obstructions
- Trees, chimneys or nearby buildings can cast shadows, greatly reducing output.
- Even partial shading on one panel can drag down production if panels are wired in series.
Temperature and Weather
- Panels work best in cooler temperatures; high heat can reduce efficiency.
- Light cloud cover might cut output by 10–30%, while heavy clouds can reduce it by 50% or more.
- Solar panels still produce in winter, although shorter days and a lower sun angle reduce output.
Age and Degradation
- Expect a 0.5% drop in output per year on average.
- After 25 years, panels may still operate around 85% of their original capacity.
- Quality, maintenance and environment all influence long-term performance.
How Many Solar Panels Do You Need?
The answer depends on your electricity use and the panel type:
- Average U.S. household usage: ~900 kWh per month.
- 400 W panels producing 50–80 kWh per month each: You’d need 12–18 panels to cover 100% of that usage.
- 500 W panels: Fewer panels are needed (10–14 panels) because each panel produces more energy.
Consider potential future needs (electric vehicle, home expansion) when sizing your system.
Solar Energy Calculator
To make things easy, we recommend using an online calculator or following this simple method:
- Determine your average daily electricity usage (kWh). Divide your monthly usage by 30.
- Choose a panel wattage (e.g., 400 W).
- Find your local peak sun hours (consult a solar map or use an estimate).
- Enter the values:
For example, if you use 30 kWh per day, have 4.5 sun hours and plan to install 400 W panels:
- 400 W × 4.5 = 1,800 Wh (1.8 kWh) per panel per day.
- 30 kWh ÷ 1.8 kWh ≈ 17 panels.
Conclusion
Solar panel technology has come a long way, and modern systems can generate enough electricity to cover most or all of a household’s needs. By understanding how wattage, sunlight and system design influence output, you can make informed decisions about how many panels you need and what kind of system will work best.
Ready to see what solar can do for you? Use a simple calculation or an online estimator to gauge your ideal system size, then work with a trusted installer to fine‑tune the design, explore incentives and maximize your savings. With the right system, solar can deliver clean, reliable power—and long‑term peace of mind.